
Strama Anywhere
Collecting data during the production and machine operation processes is useful and necessary—but only if that data can actually be analyzed. StramaAnywhere can help you do just that!
A Fresh Look at the Database
How many workpieces were produced? Why was production interrupted? How can the machine produce more efficiently? StramaAnywhere visualizes the data collected by the LineDataServer (LDS). Through visual analysis, you can identify correlations and anomalies in the production process—intuitively and without any knowledge of databases.
Comprehensive information everywhere—understandable to everyone
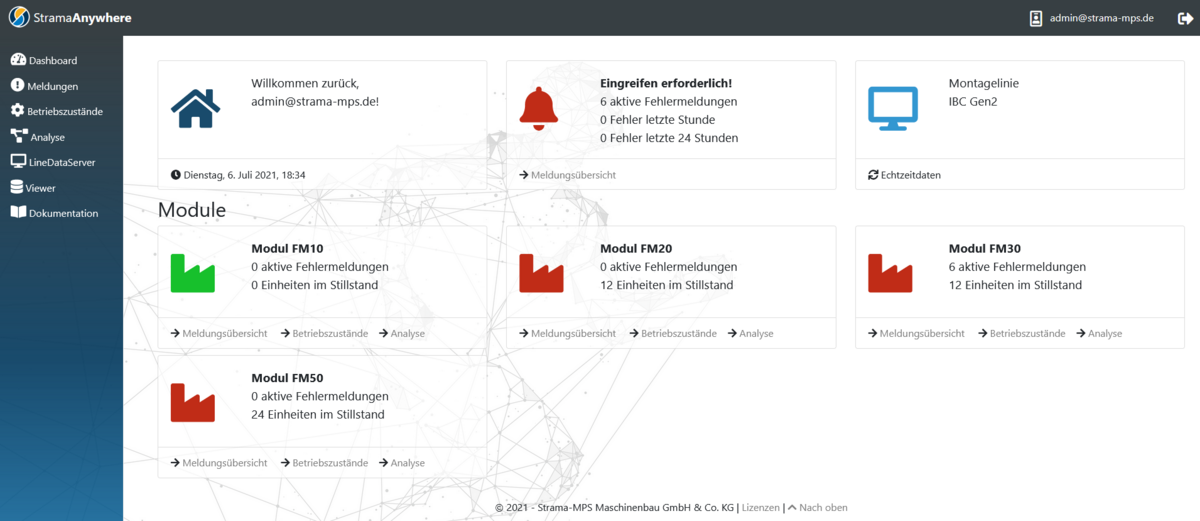
With StramaAnywhere, you can conveniently access your machine via standard web browsers—without having to install any additional software. Integrate the system into your existing corporate network and identify machine issues right from your desk or smartphone. You and your team can immediately decide on the necessary steps to take after a shutdown to minimize production downtime.
For full transparency, the production line is broken down into individual process steps. This makes it easier to identify and resolve bottlenecks (e.g., inconsistent cycle times within a shift). If a fault was overlooked during the last shift, the archive helps you reconstruct the chain of events leading to the fault.
Features Strama Anywhere
- Clear display of all key elements on a dashboard in a web browser
- Search and export the error log using filter functions (error type, error number, time period).
- Display of the top errors during a selected time period
- Analysis of NIO parts by reason for rejection
- Performance analysis through cycle time analysis
- Retrieval of module operating statuses
- Display of all current errors in the machine, including all necessary information (description, number). Export the error message to an email
- Machine documentation and operating instructions
- User account management with three access levels
- Bilingual interface in German and English
Contact Persons
![[Translate to English:]](/fileadmin/_processed_/4/3/csm_Billmeier_Web_a3f1f9bf89.webp "[Translate to English:]")